Head and Shoulders Pattern in Trading

Head and Shoulders Pattern in Trading


The head and shoulders pattern is a well-known technical analysis chart pattern that signals a potential trend reversal. The pattern derives its name from its resemblance to a human head and shoulders and is used by traders to identify potential buying and selling opportunities.


In this article, we will explore the head and shoulders pattern in more detail, discussing its formation, significance, and how traders can use it to make informed trading decisions.


Formation of the Head and Shoulders Pattern


The head and shoulders pattern is formed by three peaks or troughs in price action, with the middle peak being the highest or lowest. The pattern consists of a left shoulder, head, and right shoulder, with the head being the highest point in the pattern. The left and right shoulders are roughly the same height and are separated by the head.


The left shoulder is formed when the price of an asset rises to a new high and then pulls back. The head is formed when the price rises again, this time to a higher high, and then pulls back. Finally, the right shoulder is formed when the price rises once more, but this time to a lower high than the head, before pulling back again.


The significance of the Head and Shoulders Pattern


The head and shoulders pattern is significant because it indicates a potential trend reversal. The pattern suggests that a bullish trend may be coming to an end and that a bearish trend may be about to begin. The significance of the pattern is strengthened when the neckline, which is a line drawn across the two troughs between the left and right shoulders, is broken.


When the neckline is broken, it signals that the bears have taken control of the market, and that the price of the asset is likely to continue to fall. This can provide traders with a valuable selling opportunity, enabling them to make a profit by selling the asset at a high price before the price falls further.


How to use the Head and Shoulders Pattern in Trading


Traders can use the head and shoulders pattern in a variety of ways to make informed trading decisions. One popular strategy is to wait for the neckline to be broken before entering a short trade, which involves selling the asset in the hope of buying it back at a lower price later.


Another strategy is to use the head and shoulders pattern as a signal to exit a long trade, which involves buying the asset in the hope of selling it at a higher price later. By identifying the head and shoulders pattern early, traders can exit their long position before the price falls further, minimizing their losses.


Experienced traders may also use additional technical indicators to confirm the validity of the head and shoulders pattern. For example, traders may look at the volume of trading activity during the formation of the pattern. If the volume is high during the left shoulder, head, and right shoulder, and then drops off when the neckline is broken, it may indicate that the bears have taken control of the market and that the pattern is valid.


Another technical indicator that traders may use is the Relative Strength Index (RSI), which measures the momentum of price movements. If the RSI shows that the asset is overbought during the formation of the head and shoulders pattern, it may suggest that a trend reversal is more likely.


It's worth noting that while the head and shoulders pattern can be a powerful tool for traders, it's not foolproof, and false signals can occur. Traders should always exercise caution and use other technical indicators to confirm the validity of the pattern before making trading decisions.


HEAD AND SHOULDERS PATTERNHEAD AND SHOULDERS PATTERN


In summary, the head and shoulders pattern is a popular technical analysis tool that can be used by traders to identify potential trend reversals. The pattern consists of three peaks or troughs, with the middle peak being the highest or lowest. When the neckline is broken, it signals that a trend reversal is likely, and traders can use this signal to make informed trading decisions. However, it's important to remember that no trading strategy is foolproof, and traders should always exercise caution and use other technical indicators to confirm the validity of the pattern.

Falling Wedge Pattern in Technical Analysis

Falling Wedge Pattern in Technical Analysis


In technical analysis, chart patterns play an important role in predicting future price movements of financial assets. One of the most popular chart patterns is the falling wedge pattern. In this article, we will discuss the characteristics of the falling wedge pattern and how traders use it to make trading decisions.


What is a Falling Wedge Pattern?


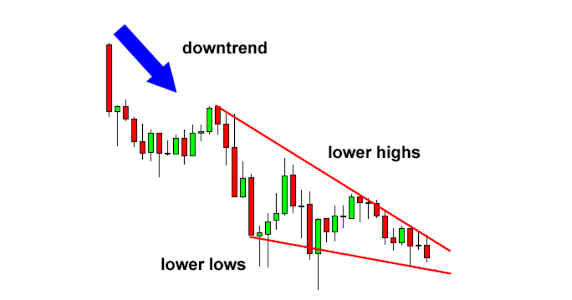
A falling wedge pattern is a bullish chart pattern that forms when the price of an asset is moving downward and creating lower highs and lower lows, but the highs and lows are converging towards each other. The pattern resembles a triangle that is tilted to the upside. It is called a wedge because the price is wedged between two trend lines. The upper trend line connects the highs, and the lower trend line connects the lows.


The falling wedge pattern is a reversal pattern that indicates that the downtrend is losing momentum, and the price is likely to reverse upward. The pattern is confirmed when the price breaks above the upper trend line, and the price action confirms the reversal. The break above the upper trend line is usually accompanied by high volume, which indicates a shift in sentiment and a surge in buying pressure.


How to Identify a Falling Wedge Pattern?


Identifying a falling wedge pattern is relatively easy. Traders need to look for two converging trend lines that are moving downward. The upper trend line connects the highs, and the lower trend line connects the lows. The pattern is confirmed when the price breaks above the upper trend line. The ideal falling wedge pattern should have at least four points that touch each trend line, with the lower trend line being steeper than the upper trend line.


How to Trade a Falling Wedge Pattern?


Traders use falling wedge patterns to make trading decisions. The pattern is a bullish signal that indicates that the downtrend is losing momentum and that a reversal is likely to occur. Traders can use the pattern to enter long positions or exit short positions. The ideal entry point is when the price breaks above the upper trend line. Traders can also use the pattern to set stop-loss orders to protect their positions from significant losses.


However, traders should be cautious when trading the falling wedge pattern. The pattern is not always reliable, and false breakouts can occur. Traders should use other technical indicators to confirm the pattern, such as momentum indicators, volume indicators, and moving averages. They should also pay attention to other market factors, such as news and events that can affect the price of the asset.


Factors Affecting the Falling Wedge Pattern


Traders should be aware of other market factors that can affect the falling wedge pattern. One factor is the volume of trading activity. When the pattern forms with high trading volume, it is more likely to indicate a reliable trend reversal. On the other hand, when the pattern forms with low trading volume, it may not be as reliable an indicator of a trend reversal.


Another factor to consider is the timeframe of the pattern. The falling wedge pattern is more reliable in longer timeframes, such as daily or weekly charts, than in shorter timeframes, such as hourly or minute charts. Traders should also be aware of other technical indicators that can confirm the pattern, such as the Relative Strength Index (RSI)Moving Average Convergence Divergence (MACD), and Bollinger Bands.


Limitations of the Falling Wedge Pattern


The falling wedge pattern is a useful tool for technical analysis, but it is not foolproof. Traders should not rely solely on the pattern to make trading decisions, as false breakouts and trend reversals can occur. It is important to use other technical indicators and market factors to confirm the pattern and to consider the overall market conditions and news events that can impact the price trend.


In addition, traders should be aware of their own trading strategy and risk tolerance when using the falling wedge pattern. They should set stop-loss orders to limit their losses and to protect their positions from significant downturns in the price trend.


FALLING WEDGE PATTERN


Conclusion


The falling wedge pattern is a bullish chart pattern that is widely used in technical analysis. Traders use the pattern to make trading decisions, such as entering long positions or exiting short positions, when the price breaks above the upper trend line. However, traders should be aware of other market factors that can impact the pattern, such as volume, timeframe, and technical indicators. They should also consider their own trading strategy and risk tolerance when using the pattern. By using the falling wedge pattern as part of a larger technical analysis toolkit, traders can make informed decisions about buying and selling financial assets.

Rising Wedge Pattern in Technical Analysis

Rising Wedge Pattern in Technical Analysis

Technical analysis is an approach to forecasting future price movements of financial instruments based on past data. It is widely used by traders and investors to make informed decisions about buying or selling assets. One of the most popular chart patterns used in technical analysis is the rising wedge pattern. In this article, we will discuss the characteristics of the rising wedge pattern and how traders use it to make trading decisions.

What is a Rising Wedge Pattern?

A rising wedge pattern is a bearish chart pattern that forms when the price of an asset is moving upward and creating higher highs and higher lows, but the highs and lows are converging towards each other. The pattern resembles a triangle that is tilted to the downside. It is called a wedge because the price is wedged between two trend lines. The upper trend line connects the highs, and the lower trend line connects the lows.

The rising wedge pattern is a reversal pattern that indicates that the uptrend is losing momentum, and the price is likely to reverse downward. The pattern is confirmed when the price breaks below the lower trend line, and the price action confirms the reversal. The break below the lower trend line is usually accompanied by high volume, which indicates a shift in sentiment and a surge in selling pressure.

How to Identify a Rising Wedge Pattern?

Identifying a rising wedge pattern is relatively easy. Traders need to look for two converging trend lines that are moving upward. The upper trend line connects the highs, and the lower trend line connects the lows. The pattern is confirmed when the price breaks below the lower trend line. The ideal rising wedge pattern should have at least four points that touch each trend line, with the upper trend line being steeper than the lower trend line.

How to Trade a Rising Wedge Pattern?

Traders use rising wedge patterns to make trading decisions. The pattern is a bearish signal that indicates that the uptrend is losing momentum and that a reversal is likely to occur. Traders can use the pattern to enter short positions or exit long positions. The ideal entry point is when the price breaks below the lower trend line. Traders can also use the pattern to set stop-loss orders to protect their positions from significant losses.

However, traders should be cautious when trading the rising wedge pattern. The pattern is not always reliable, and false breakouts can occur. Traders should use other technical indicators to confirm the pattern, such as momentum indicators, volume indicators, and moving averages. They should also pay attention to other market factors, such as news and events that can affect the price of the asset.

Factors Affecting the Rising Wedge Pattern

Traders should be aware of other market factors that can affect the rising wedge pattern. One factor is the volume of trading activity. When the pattern forms with high trading volume, it is more likely to indicate a reversal in the price trend. On the other hand, when the pattern forms with low trading volume, it may not be as reliable an indicator of a trend reversal.

Another factor to consider is the timeframe of the pattern. The rising wedge pattern is more reliable in longer timeframes, such as daily or weekly charts, than in shorter timeframes, such as hourly or minute charts. Traders should also be aware of other technical indicators that can confirm the pattern, such as the Relative Strength Index (RSI), Moving Average Convergence Divergence (MACD), and Bollinger Bands.

Limitations of the Rising Wedge Pattern

The rising wedge pattern is a useful tool for technical analysis, but it is not foolproof. Traders should not rely solely on the pattern to make trading decisions, as false breakouts and trend reversals can occur. It is important to use other technical indicators and market factors to confirm the pattern and to consider the overall market conditions and news events that can impact the price trend.

In addition, traders should be aware of their own trading strategy and risk tolerance when using the rising wedge pattern. They should set stop-loss orders to limit their losses and to protect their positions from significant downturns in the price trend.


RISING WEDGE PATTERNRISING WEDGE PATTERN


Conclusion

The rising wedge pattern is a bearish chart pattern that is widely used in technical analysis. Traders use the pattern to make trading decisions, such as entering short positions or exiting long positions, when the price breaks below the lower trend line. However, traders should be aware of other market factors that can impact the pattern, such as volume, timeframe, and technical indicators. They should also consider their own trading strategy and risk tolerance when using the pattern. By using the rising wedge pattern as part of a larger technical analysis toolkit, traders can make informed decisions about buying and selling financial assets.

Technical Analysis in Forex | What is Technical Analysis?

Technical Analysis in Forex | What is Technical Analysis?

Forex trading is a complex process, and it involves various aspects that require careful consideration. One of the critical components of forex trading is technical analysis. Technical analysis involves the study of historical price and volume data to identify trends and patterns that can help traders make informed decisions. In this article, we will delve into technical analysis in forex trading and discuss its importance.


What is Technical Analysis?


Technical analysis is a method of forecasting future price movements based on past price data. It is a tool used by traders to analyze market trends and identify potential trading opportunities. Technical analysts use charts and other technical indicators to study price movements and determine the direction of the market.


Technical Analysis Tools


There are numerous tools and indicators that technical analysts use to study price movements. Some of the commonly used technical analysis tools in forex trading include:


1.    Moving Averages: A moving average is a trend-following indicator that smoothens out price movements by calculating the average price of a currency pair over a specified period. It helps traders identify the direction of the trend and potential entry and exit points.


2.    Relative Strength Index (RSI): The RSI is a momentum indicator that measures the strength of the price movement. It helps traders determine whether a currency pair is oversold or overbought, which can signal a potential reversal.


3.    Bollinger Bands: Bollinger Bands are volatility indicators that show the upper and lower limits of a currency pair's price movements. They help traders determine potential entry and exit points based on the currency pair's volatility.


4.    Fibonacci Retracement: Fibonacci retracement is a technical analysis tool used to identify potential support and resistance levels. It involves drawing horizontal lines at key levels based on the Fibonacci sequence.


Importance of Technical Analysis in Forex Trading


Technical analysis plays a crucial role in forex trading. Here are some of the reasons why technical analysis is essential:


1.    Identifying Trends: Technical analysis helps traders identify the direction of the market trend. By studying historical price data, traders can determine whether the market is in an uptrend or a downtrend, which can help them make informed trading decisions.


2.    Entry and Exit Points: Technical analysis helps traders identify potential entry and exit points based on support and resistance levels, moving averages, and other technical indicators. This helps traders enter and exit trades at the right time, which can maximize their profits and minimize their losses.


3.    Risk Management: Technical analysis helps traders manage their risk by identifying potential stop-loss levels. Stop-loss orders can be placed at key levels to limit the amount of loss in case the trade goes against the trader.


4.    Confirmation: Technical analysis can confirm a trader's fundamental analysis. By studying price movements, technical analysts can confirm whether the market is responding to fundamental factors or not. This helps traders make more informed trading decisions.


Certainly, here are some additional points to consider when it comes to technical analysis in forex trading:


1.    Timeframes: Technical analysis can be used across various timeframes, from short-term (intraday) to long-term (weekly or monthly). The timeframe used depends on the trader's goals, trading style, and risk tolerance.


2.    Limitations: While technical analysis can provide valuable insights into the market, it is not a foolproof method. Market conditions can change rapidly, and unexpected events can impact price movements, rendering technical analysis obsolete. Therefore, it is important to use technical analysis alongside other analytical tools and to stay up-to-date with market news and events.


3.    Backtesting: Backtesting involves applying technical analysis to historical data to see how well it would have performed in the past. This can help traders refine their trading strategies and improve their chances of success in the future.


4.    Education: To effectively use technical analysis in forex trading, traders need to have a good understanding of the underlying concepts, tools, and indicators. There are numerous resources available online, including books, articles, and video tutorials, that can help traders improve their technical analysis skills.


TECHNICAL ANALYSIS IN FOREXTECHNICAL ANALYSIS IN FOREX


Conclusion


Technical analysis is an essential tool in forex trading. It helps traders identify trends, potential entry and exit points, manage risk, and confirm fundamental analysis. Technical analysis involves the use of various tools and indicators to study price movements and make informed trading decisions. As a forex trader, it is essential to understand technical analysis and how to use it effectively.

Hammer Candlestick: A Powerful Tool in Technical Analysis

Hammer Candlestick: A Powerful Tool in Technical Analysis


When it comes to technical analysis, there are many tools that traders can use to make better decisions. One of the most popular and reliable of these tools is the hammer candlestick. In this article, we will explore what the hammer candlestick is, how it works, and how you can use it in your trading strategies.


What is a Hammer Candlestick?


A hammer candlestick is a type of candlestick pattern that forms when the price of an asset has been in a downtrend but then experiences a sudden reversal. The candlestick looks like a hammer, with a small body and a long lower wick or shadow. The long lower wick indicates that the price of the asset fell significantly during the trading session but was eventually bought back up by buyers.


How does it work?


The hammer candlestick is a bullish reversal pattern, meaning that it suggests that a downtrend may be coming to an end and that a new uptrend may be beginning. The long lower wick indicates that there was a lot of buying pressure at that level, which is often seen as a strong support level. When the price falls below this level, it triggers a wave of buying that can drive the price higher.


To confirm the validity of the hammer candlestick, traders will often look for other signals that suggest a reversal is taking place. For example, they may look for a divergence between the price and an oscillator, such as the relative strength index (RSI), which can indicate that momentum is shifting in favor of buyers. Additionally, traders may look for other bullish candlestick patterns that suggest a reversal is imminent.


How can you use it in your trading strategies?


The hammer candlestick can be a powerful tool in your trading arsenal, but it should not be used in isolation. Instead, traders should look for other confirmation signals and use the hammer candlestick as one piece of the puzzle.


For example, a trader may look for a hammer candlestick to form near a significant support level, such as a moving average or a trendline. They may also look for the candlestick to form after a period of consolidation or a significant price drop. In these scenarios, the hammer candlestick can provide a strong buy signal that can help traders enter the market with confidence.


However, traders should also be aware of the risks involved in trading with the hammer candlestick. While it is a powerful reversal pattern, it is not foolproof, and there is always the risk that the price could continue to fall. As such, traders should always use appropriate risk management techniques, such as stop-loss orders, to limit their exposure to potential losses.


Advanced traders can also use the hammer pattern in conjunction with other technical analysis tools such as moving averages, trend lines, and support and resistance levels. For example, if a hammer pattern forms near a key support level or a moving average, it can be a stronger signal of a potential trend reversal.


Traders can also use the hammer pattern to set stop-loss orders and profit targets. If a trader takes a long position after a confirmed hammer pattern, they can place a stop-loss order below the low of the hammer candlestick to limit their potential losses. Profit targets can be set based on the next resistance level or based on the length of the wick of the hammer candlestick.


It's important to note that the hammer pattern should not be used in isolation and should always be considered in the broader context of the market. For example, if there is a significant news event or a fundamental shift in the market, the hammer pattern may not be as reliable as usual.


Traders should also be aware of false signals, which can occur when a hammer pattern forms but is not confirmed by the next candlestick. In such cases, the market may continue to move in the same direction, and traders who entered based on the hammer pattern may suffer losses.


HAMMER CANDLESTICKHAMMER CANDLESTICK


Conclusion

In conclusion, the hammer candlestick pattern is a powerful tool for technical analysis that can provide valuable insights into market sentiment and trend direction. However, it should be used in conjunction with other technical analysis tools and should always be considered in the broader context of the market. With proper analysis and risk management, the hammer pattern can be a useful tool for traders and investors looking to profit from market trends.


Double Bottom Chart Pattern: How to Identify and Trade

Double Bottom Chart Pattern: How to Identify and Trade this Reversal Pattern


The Double Bottom chart pattern is a popular technical analysis tool used by traders and investors to identify potential market reversals. This pattern occurs when a stock, currency or commodity reaches a low price, bounces back, and then returns to that same low price again before bouncing back once more. This creates a pattern that resembles the letter "W". When the price breaks through the resistance level that was formed by the previous high, it is a clear signal that the trend has reversed.


Identifying the Double Bottom pattern is relatively straightforward. Traders should look for two lows that are roughly at the same price level, with a clear bounce back in between. The resistance level is formed by connecting the highs of the bounce back. Once the price breaks through this resistance level, it is a clear signal that the trend has reversed.


There are several key factors to keep in mind when trading the Double Bottom pattern. First, it is important to always use proper risk management techniques and to be prepared for the possibility that the pattern may not confirm as expected. Traders should always set stop-loss orders to limit their losses in case the price does not reverse as anticipated.


Second, it is important to use other technical indicators in conjunction with the Double Bottom pattern to confirm the potential reversal. For example, traders may use trendlines, moving averages, and volume to provide additional confirmation that the trend is indeed reversing.


Third, traders should pay attention to the duration of the Double Bottom pattern. The longer the pattern takes to form, the more significant the potential reversal is likely to be. Additionally, traders should look for other factors that may be contributing to the reversal, such as changes in economic conditions, political events, or other market fundamentals.


Finally, traders should be aware of the potential for false breakouts. False breakouts occur when the price appears to break through the resistance level of the Double Bottom pattern, only to quickly reverse and continue in the original direction. To avoid false breakouts, traders should wait for confirmation that the price is truly reversing before entering a trade.


It is important to note that the Double Bottom pattern is not the only reversal pattern that traders can use to identify potential market reversals. Other popular reversal patterns include the Double Top pattern, the Head and Shoulders pattern, and the Triple Top and Bottom patterns.


When trading the Double Bottom pattern, traders can enter a long position once the price breaks through the resistance level of the pattern. They can then set a stop-loss order below the support level of the pattern to limit their losses in case the price reverses again.


Alternatively, traders can use the Double Bottom pattern to confirm a long-term bullish trend. If a market has been trending downwards for an extended period of time, a Double Bottom pattern may indicate that the trend is coming to an end and that the market is about to enter a long-term bullish trend. In this case, traders may consider exiting any short positions they have in the market and entering long positions to profit from the rising market.


DOUBLE BOTTOM PATTERNDOUBLE BOTTOM PATTERN


Conclusion

In conclusion, the Double Bottom chart pattern is a reliable tool for identifying potential market reversals. Traders and investors can use this pattern to identify potential opportunities for long trades or to confirm a long-term bullish trend. By understanding how to identify and trade this pattern, traders can make better-informed decisions and take advantage of market trends. However, it is important to always use proper risk management techniques and to confirm the potential reversal with other technical indicators and market fundamentals.


Double Top Chart Pattern: How to Identify and Trade

Double Top Chart Pattern: How to Identify and Trade this Reversal Pattern


The Double Top chart pattern is a popular technical analysis tool used by traders and investors to identify potential market reversals. This pattern occurs when a stock, currency or commodity reaches a high price, pulls back, and then returns to that same high price again before pulling back once more. This creates a pattern that resembles the letter "M". When the price breaks through the support level that was formed by the previous low, it is a clear signal that the trend has reversed.


Identifying the Double Top pattern is relatively straightforward. Traders should look for two peaks that are roughly at the same price level, with a clear pullback in between. The support level is formed by connecting the lows of the pullback. Once the price breaks through this support level, it is a clear signal that the trend has reversed.


There are several key factors to keep in mind when trading the Double Top pattern. First, it is important to always use proper risk management techniques and to be prepared for the possibility that the pattern may not confirm as expected. Traders should always set stop-loss orders to limit their losses in case the price does not reverse as anticipated.


Second, it is important to use other technical indicators in conjunction with the Double Top pattern to confirm the potential reversal. For example, traders may use trendlines, moving averages, and volume to provide additional confirmation that the trend is indeed reversing.


Third, traders should pay attention to the duration of the Double Top pattern. The longer the pattern takes to form, the more significant the potential reversal is likely to be. Additionally, traders should look for other factors that may be contributing to the reversal, such as changes in economic conditions, political events, or other market fundamentals.


Finally, traders should be aware of the potential for false breakouts. False breakouts occur when the price appears to break through the support level of the Double Top pattern, only to quickly reverse and continue in the original direction. To avoid false breakouts, traders should wait for confirmation that the price is truly reversing before entering a trade.


Traders and investors often use the Double Top pattern to identify potential opportunities for short trades, where they can profit from a declining market. To trade this pattern, traders can enter a short position once the price breaks through the support level of the Double Top pattern. They can then set a stop-loss order above the resistance level of the pattern to limit their losses in case the price reverses again.


Alternatively, traders can use the Double Top pattern to confirm a long-term bearish trend. If a market has been trending upwards for an extended period of time, a Double Top pattern may indicate that the trend is coming to an end and that the market is about to enter a long-term bearish trend. In this case, traders may consider exiting any long positions they have in the market and entering short positions to profit from the declining market.


It is also worth noting that the Double Top pattern is not the only reversal pattern that traders can use to identify potential market reversals. Other popular reversal patterns include the Head and Shoulders pattern, the Double Bottom pattern, and the Triple Top and Bottom patterns.


DOUBLE TOP CHART PATTERNDOUBLE TOP CHART PATTERN


Conclusion

In conclusion, the Double Top chart pattern is a reliable tool for identifying potential market reversals. Traders and investors can use this pattern to identify potential opportunities for short trades or to confirm a long-term bearish trend. By understanding how to identify and trade this pattern, traders can make better-informed decisions and take advantage of market trends. However, it is important to always use proper risk management techniques and to confirm the potential reversal with other technical indicators and market fundamentals.

POPULAR POSTS