Divergence Forex Trading : Powerful Tool for Trend Reversals

Divergence Forex Trading: A Powerful Tool for Identifying Trend Reversals


Forex trading can be a challenging endeavor, requiring careful analysis and risk management. One of the most powerful tools in a trader's arsenal is the use of divergence analysis. Divergence forex trading is a technical analysis technique that can help traders identify trend reversals and potential trading opportunities.


Divergence occurs when the price of a currency pair moves in a different direction than the oscillator or indicator that is being used to track price movement. This can indicate a weakening trend or a potential trend reversal, making divergence analysis a powerful tool for traders.


There are two types of divergence: regular and hidden. Regular divergence occurs when the price of a currency pair moves in one direction and the oscillator or indicator moves in the opposite direction. This can indicate a potential trend reversal, as the momentum of the price movement is weakening. Hidden divergence occurs when the price of a currency pair moves in one direction and the oscillator or indicator moves in the same direction, but with less momentum. This can indicate that the trend is still strong, but may be losing momentum and could potentially reverse.


Divergence analysis can be used with a variety of technical indicators, including the Relative Strength Index (RSI), Moving Average Convergence Divergence (MACD), and the Stochastic Oscillator. Traders can use these indicators to identify potential divergence patterns and then use them to make trading decisions.


One of the key benefits of using divergence analysis in forex trading is that it can help traders identify potential entry and exit points for trades. For example, if a trader is using the RSI indicator and identifies a regular bearish divergence pattern, this could indicate a potential trend reversal and a good time to exit a long position or enter a short position. Similarly, if a trader identifies a hidden bullish divergence pattern, this could indicate that a strong trend is still in place and provide a good opportunity to enter a long position.


It's important to note that divergence analysis is just one tool in a trader's toolbox and should be used in conjunction with other technical and fundamental analysis techniques. Additionally, it's important to use proper risk management techniques when trading forex, as the market can be volatile and unpredictable.


Specifically, there are a few key strategies that traders can use when implementing divergence analysis in their forex trading:


Confirming Divergence with Other Indicators - While divergence analysis can be powerful, it's important to confirm any potential trend reversals with other technical indicators or fundamental analysis. For example, if a trader identifies a regular bearish divergence pattern using the RSI, they might also look for a support level to confirm the potential reversal. By combining multiple indicators, traders can reduce the risk of false signals and make more informed trading decisions.


Using Multiple Time Frames - Divergence analysis can also be effective when used across multiple time frames. For example, a trader might use the MACD indicator to identify bullish divergence on a daily chart, but also look for confirmation of the trend reversal on a shorter time frame, such as a 15-minute chart. This can help traders identify potential entry and exit points more accurately and reduce the risk of false signals.


Using Divergence to Identify Continuation Patterns - While divergence analysis is often used to identify trend reversals, it can also be effective for identifying continuation patterns. For example, a trader might use the Stochastic Oscillator to identify hidden bullish divergence, indicating that a strong uptrend is likely to continue. By using divergence analysis in this way, traders can identify potential trading opportunities even when the market is trending strongly in one direction.


DIVERGENCE FOREX TRADINGDIVERGENCE FOREX TRADING


Conclusion

In conclusion, divergence analysis is a powerful tool for identifying trend reversals and potential trading opportunities in forex trading. By using technical indicators to identify regular and hidden divergence patterns, traders can make informed trading decisions and manage risk more effectively. However, it's important to use divergence analysis in conjunction with other analysis techniques and to practice proper risk management when trading forex.

Flag Continuation Pattern : A Technical Analysis Tool

Flag Continuation Pattern: A Technical Analysis Tool for Traders

Technical analysis is a widely used approach for analyzing financial markets. It involves the use of price charts, indicators, and other statistical tools to identify trends, patterns, and potential trading opportunities. One of the most popular technical analysis tools is the flag continuation pattern. In this article, we will explore the flag continuation pattern, how it works, and how traders can use it to make better trading decisions.


What is a Flag Continuation Pattern?

A flag continuation pattern is a bullish or bearish chart pattern that appears in the middle of a trend. It is called a continuation pattern because it suggests that the existing trend will continue after a brief consolidation period. The pattern is formed when the price movement takes the shape of a flag or pennant, which is a rectangle or a parallelogram with a flagpole.

The flagpole is the initial trend that forms the basis for the pattern. The flag or pennant is formed when the price consolidates within a narrow range, forming a symmetrical triangle or a wedge. The pattern is complete when the price breaks out of the flag or pennant in the same direction as the initial trend. Traders often use this breakout as a signal to enter a trade in the direction of the trend.


How to Identify a Flag Continuation Pattern?

To identify a flag continuation pattern, traders need to look for a few key elements:

The Flagpole: The pattern starts with a strong price movement that creates the flagpole. This movement should be significant and preferably accompanied by high trading volumes.

The Flag or Pennant: After the initial price movement, the price consolidates into a narrow range, forming a flag or pennant. The consolidation period should last for at least a few days, and the price movement within the pattern should be sideways or slightly against the trend.

Breakout: The pattern is complete when the price breaks out of the flag or pennant in the same direction as the initial trend. Traders often use this breakout as a signal to enter a trade in the direction of the trend.


Why is the Flag Continuation Pattern Important?

The flag continuation pattern is important because it provides traders with a reliable signal to enter a trade in the direction of the trend. By identifying this pattern, traders can capitalize on the momentum of the trend and potentially generate profits. The pattern is also easy to identify and understand, making it a popular tool for traders of all levels.


How to Trade Using the Flag Continuation Pattern?

Traders can use the flag continuation pattern in various ways. One of the most common strategies is to wait for the breakout and enter a trade in the direction of the trend. Traders can place a stop-loss order below the flag or pennant to limit their losses if the price reverses. They can also use technical indicators, such as moving averages or oscillators, to confirm the strength of the trend before entering a trade.

Another approach is to use the flag continuation pattern as a filter for other trading signals. For example, a trader may use a moving average crossover as a signal to enter a trade, but only if the price is also forming a flag continuation pattern. This can help filter out false signals and increase the probability of success.

Flag continuation pattern is not only useful in trading stocks but can also be applied to other financial markets, such as forex, commodities, and cryptocurrencies. Traders can use this pattern to identify potential trading opportunities in any market that exhibits a clear trend.

It is essential to note that the flag continuation pattern is not always a reliable indicator of future price movements. Like any technical analysis tool, it has its limitations and can produce false signals. Therefore, traders should not rely solely on this pattern and should use other technical indicators and fundamental analysis to confirm their trading decisions.

Furthermore, traders should also consider the risk-reward ratio before entering any trade using the flag continuation pattern. The risk-reward ratio is a measure of the potential profit of a trade relative to its potential loss. Traders should aim for a risk-reward ratio of at least 1:2 or higher to ensure that their potential profits are greater than their potential losses.


FLAG CONTINUATION PATTERNFLAG CONTINUATION PATTERN


Conclusion

The flag continuation pattern is a popular technical analysis tool used by traders to identify potential trading opportunities in financial markets. This pattern suggests that the existing trend will continue after a brief consolidation period, and traders can use the breakout as a signal to enter a trade in the direction of the trend. By understanding how to identify and trade this pattern, traders can potentially generate profits and improve their trading performance. However, like any technical analysis tool, it is not foolproof and requires careful risk management and analysis to be effective.

Diamond Pattern Trading : A Guide for Investors

Diamond Pattern Trading: A Guide for Investors


The stock market is an ever-changing world, where investors are always looking for new ways to gain an edge. One trading strategy that has gained popularity in recent years is the diamond pattern trading strategy. This strategy is based on the diamond chart pattern, which is a technical analysis tool used to identify potential market reversals.


What is a Diamond Chart Pattern?

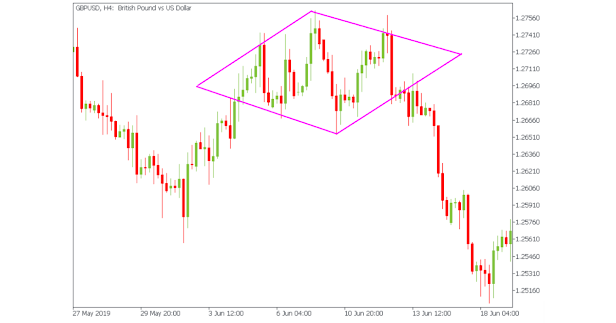
The diamond chart pattern is a rare pattern that occurs when there is a significant trend in the market, followed by a consolidation period, and then a breakout in the opposite direction. The diamond pattern trading resembles a diamond shape on the chart and is formed by four trend lines. The upper and lower trend lines are drawn parallel to each other, while the two other trend lines are drawn at a 45-degree angle to the horizontal trend lines.


How to Trade the Diamond Chart Pattern?

Trading the diamond chart pattern involves identifying the pattern on the chart and then placing trades accordingly. The pattern is identified by connecting the highs and lows of the price action with trend lines. Once the pattern is identified, traders can use various technical analysis tools to confirm the pattern's validity.

One way to confirm the pattern is to use volume analysis. Traders can look for a significant increase in volume during the breakout phase, indicating that the price is likely to continue in the breakout direction. Another way to confirm the pattern is to use oscillators, such as the Relative Strength Index (RSI), to identify overbought or oversold conditions.


Once the pattern is confirmed, traders can place trades in the breakout direction. They can set stop-loss orders below the breakout point to limit their risk and take-profit orders at a predetermined level to secure profits.


Advantages of Diamond Pattern Trading

The diamond pattern trading strategy has several advantages. First, it is a reliable pattern that occurs rarely, making it a valuable tool for identifying potential market reversals. Second, the pattern is relatively easy to identify and can be used in conjunction with other technical analysis tools for confirmation. Third, the pattern can be applied to various time frames, making it suitable for traders of all experience levels.


Risks of Diamond Pattern Trading

Like any trading strategy, diamond pattern trading comes with risks. The pattern can fail to confirm, leading to losses for traders who placed trades in anticipation of a breakout. Traders also need to be careful not to enter trades too early or too late, as this can result in missed opportunities or losses.

In addition to the advantages and risks of diamond pattern trading, there are a few more things to keep in mind when using this strategy.

Firstly, it is important to remember that the diamond pattern is a technical analysis tool, and should not be used in isolation. Traders should use other indicators and tools to confirm the pattern's validity and support their trading decisions.

Secondly, traders should also consider the broader market conditions when using the diamond pattern. A diamond pattern may be more reliable in a trending market than in a sideways market, for example.

Thirdly, traders should also consider the time frame they are trading on. The diamond pattern may be more significant on longer time frames, such as daily or weekly charts, than on shorter time frames such as hourly or 15-minute charts.

Lastly, it is important for traders to have a solid understanding of risk management when using the diamond pattern trading strategy. This means using appropriate stop-loss orders, position sizing, and taking into account the potential for market volatility.


DIAMOND PATTERN TRADINGDIAMOND PATTERN TRADING


Conclusion

The diamond pattern trading strategy is a valuable tool for identifying potential market reversals. Traders can use the pattern to place trades in the breakout direction, with stop-loss and take-profit orders to manage risk and secure profits. However, traders should be aware of the risks involved in diamond pattern trading and use proper risk management techniques to minimize losses.

Descending Triangle Patterns in Trading

Understanding the Descending Triangle Patterns in Trading


When it comes to technical analysis in trading, there are various patterns that traders use to identify potential opportunities in the market. One such pattern is the descending triangle patterns, which is commonly used by traders to predict future price movements. In this article, we will explore the descending triangle pattern, how it works, and how traders can use it to their advantage.


What is a Descending Triangle Pattern?

A descending triangle patterns is a bearish continuation pattern that forms during a downtrend in the market. It is created by connecting a series of lower highs with a horizontal support line. This results in a triangle shape that resembles a staircase going downwards. The horizontal support line acts as a strong level of support that has been tested multiple times. The lower highs indicate that sellers are still in control, and they are pushing the price down.

The psychology behind this pattern is that buyers are losing confidence in the market, and the sellers are taking advantage of the situation by selling at every opportunity. However, the buyers are still present in the market, and they are waiting for the price to drop to a level where they feel comfortable buying. This creates a level of demand that supports the horizontal support line.


How to Identify a Descending Triangle Pattern

To identify a descending triangle pattern, traders need to look for the following characteristics:

1.    The price is in a downtrend.

2.    The pattern consists of a horizontal support line and a series of lower highs.

3.    The volume is decreasing as the pattern forms.

4.    The pattern typically lasts between three and six weeks.

Once the pattern is identified, traders can use technical indicators to confirm the pattern and make a trading decision.


Trading the Descending Triangle Pattern

Trading the descending triangle pattern involves waiting for the price to break below the horizontal support line. This indicates that the sellers have gained control and are pushing the price down further. Traders can use technical indicators such as the Relative Strength Index (RSI) or the Moving Average Convergence Divergence (MACD) to confirm the bearish momentum.

Traders can enter a short position once the price breaks below the support line and place a stop-loss order above the support line. The profit target can be set based on the distance between the support line and the previous low. Traders can also use trailing stop-loss orders to lock in profits as the price moves in their favor.


Advanced strategies for trading Descending Triangle Pattern


While the basic trading strategy for the descending triangle pattern involves waiting for the price to break below the support line and entering a short position, there are more advanced strategies that traders can use to maximize their profits.


Trading the False Breakout

False breakouts occur when the price breaks below the support line but quickly reverses and moves back above it. This can happen when traders panic and sell too early, leading to a temporary drop in the price. However, if the support line holds, it can signal a potential reversal and a buying opportunity for traders.


To trade a false breakout, traders can wait for the price to break below the support line and enter a short position. However, they should also place a buy order above the support line in case of a false breakout. If the price reverses and moves above the support line, the buy order will be triggered, and traders can exit their short position and enter a long position.


Trading the Pullback

A pullback occurs when the price briefly moves above the support line after breaking below it. This can happen when traders take profits or when buyers see the lower prices as a buying opportunity. However, if the support line holds, it can signal a potential continuation of the downtrend.

To trade a pullback, traders can wait for the price to break below the support line and enter a short position. However, they should also look for signs of a pullback, such as a bullish candlestick pattern or an increase in volume. Once the price pulls back to the support line, traders can enter a short position with a tighter stop-loss order.


Trading the Breakout Retest

A breakout retest occurs when the price breaks below the support line, retests it as resistance, and then continues to move lower. This can happen when traders who missed the initial breakout try to enter a short position at the retest, leading to a temporary increase in the price. However, if the resistance holds, it can signal a potential continuation of the downtrend.

To trade a breakout retest, traders can wait for the price to break below the support line and enter a short position. However, they should also look for signs of a retest, such as a bearish candlestick pattern or a decrease in volume. Once the price retests the support line as resistance and starts to move lower, traders can enter a short position with a tighter stop-loss order.


DESCENDING TRIANGLE PATTERNSDESCENDING TRIANGLE PATTERNS


Conclusion

The descending triangle pattern is a powerful tool in a trader's arsenal, and there are various strategies that traders can use to maximize their profits. Whether traders are trading false breakouts, pullbacks, or breakout retests, it's important to understand the characteristics of the pattern and use technical indicators to confirm their analysis before making a trading decision. By using advanced strategies, traders can improve their chances of success in the markets and achieve their financial goals.

Ascending Triangle Patterns: A Guide for Traders

Ascending Triangle Patterns: A Guide for Traders

If you are an avid trader, you must have heard of the ascending triangle patterns. It is a powerful pattern that can help you identify potential breakouts and maximize profits. In this article, we will take a closer look at the ascending triangle pattern, its characteristics, and how you can use it in your trading strategy.


What is an Ascending Triangle Pattern?

An ascending triangle patterns is a bullish continuation pattern that is formed when the price of an asset is trending upwards and creates a series of higher lows. At the same time, there is a horizontal resistance level that prevents the price from moving higher. This creates a triangle formation, with the higher lows forming the ascending trendline and the horizontal resistance level forming the flat upper trendline.

The ascending triangle pattern is considered a bullish continuation pattern because it suggests that the price will continue to rise after a breakout above the horizontal resistance level. Traders use this pattern to identify potential entry points for long positions.


Characteristics of an Ascending Triangle Pattern

To identify an ascending triangle pattern, look for the following characteristics:

Higher lows: There should be a series of higher lows that form the ascending trendline. The more touches the trendline has, the stronger the pattern.

Flat upper trendline: The upper trendline should be horizontal and act as resistance to the price. This level should be tested at least twice before a breakout occurs.

Volume: The volume should decrease as the pattern forms, indicating that traders are hesitant to buy or sell until a breakout occurs. However, volume should increase once a breakout occurs.


How to Trade an Ascending Triangle Pattern

To trade an ascending triangle pattern, follow these steps:

Identify the pattern: Use technical analysis tools to identify the pattern on the chart.

Set an entry point: Enter a long position when the price breaks above the horizontal resistance level with high volume.

Set a stop-loss: Place a stop-loss order below the ascending trendline to protect against potential losses.

Set a target price: Determine a target price by measuring the distance between the horizontal resistance level and the lowest point of the ascending trendline. This distance should be added to the breakout point to determine the target price.

Monitor the trade: Watch the trade closely and adjust the stop-loss and target price as needed.


Tips for Trading Ascending Triangle Patterns

Look for other indicators: While the ascending triangle pattern can be a strong indicator on its own, it's important to look for other technical indicators that support the pattern. For example, you may want to use a moving average to confirm the trend or look for bullish candlestick patterns.

Be patient: It's important to be patient and wait for a breakout above the horizontal resistance level. Don't jump the gun and enter a trade prematurely. Wait for the confirmation of a breakout with high volume before entering a long position.

Use proper risk management: As with any trading strategy, it's important to use proper risk management techniques. Set a stop-loss order to limit potential losses, and adjust it as the trade progresses. Also, don't risk more than you can afford to lose, and never let emotions cloud your judgement.

Combine with other patterns: Consider combining the ascending triangle pattern with other bullish continuation patterns, such as the bull flag or pennant pattern. This can provide additional confirmation and increase the likelihood of a successful trade.


ASCENDING TRIANGLE PATTERNSASCENDING TRIANGLE PATTERNS


Conclusion

The ascending triangle pattern is a powerful tool for traders to identify potential breakouts and maximize profits. By understanding the characteristics of this pattern and following a solid trading strategy, traders can take advantage of bullish continuation patterns and profit from rising prices. As with any trading strategy, it is important to manage risk and monitor the trade closely to ensure success.

How to Open an Exness Trading Account

How to Open an Exness Trading Account: A Step-by-Step Guide


How to open an exness trading account : Exness is a well-known online forex broker that offers trading services to clients in more than 180 countries. If you're interested in trading forex or other financial instruments with Exness, the first step is to open a trading account. In this article, we'll guide you through the process of opening an Exness trading account.


Step 1: Visit the Exness website

The first step in opening an Exness trading account is to visit their website at Exness trading Platform. Once you're on the website, click on the "Register" button at the top right corner of the homepage.


Step 2: Choose your account type

Exness offers four different account types: Mini, Classic, ECN, and Raw Spread. Each account type has its own unique features and trading conditions, so it's important to choose the one that best suits your trading needs.


Step 3: Fill in your personal information

Once you've chosen your account type, you'll be asked to provide some personal information, such as your name, email address, phone number, and country of residence. Make sure to fill in all the required fields accurately.


Step 4: Verify your email address

After you've filled in your personal information, Exness will send you an email with a verification link. Click on the link to verify your email address.


Step 5: Provide additional information

Next, you'll be asked to provide some additional information, such as your date of birth, occupation, and trading experience. This information helps Exness to comply with regulatory requirements and ensure that their services are suitable for your trading needs.


Step 6: Upload your documents

To complete the account opening process, you'll need to upload some identification documents, such as a passport or national ID card, and a proof of address, such as a utility bill or bank statement. Make sure to upload clear and legible copies of your documents to avoid any delays in the verification process.


Step 7: Fund your account

Once your account has been verified, you can fund it with your preferred payment method, such as bank transfer, credit/debit card, or electronic wallets like Skrill or Neteller. Exness offers a wide range of deposit options with low minimum deposit requirements.


Step 8: Start trading

Congratulations! You've successfully opened an Exness trading account and funded it. Now you can start trading forex and other financial instruments on the Exness platform. Make sure to download the Exness trading platform and familiarize yourself with its features and tools before placing any trades.


Some additional tips to keep in mind while opening an Exness trading account:


Choose the right account type: As mentioned earlier, Exness offers four different account types, each with its own features and trading conditions. Make sure to choose the one that best suits your trading style and preferences.


Verify your account as soon as possible: To ensure the security of their clients' funds and comply with regulatory requirements, Exness requires all clients to verify their accounts by providing identification and address proof documents. Make sure to complete the verification process as soon as possible to avoid any delays in accessing your trading account.


Familiarize yourself with the trading platform: Before placing any trades, make sure to download the Exness trading platform and familiarize yourself with its features and tools. Exness offers a user-friendly and intuitive platform with advanced charting and analysis tools that can help you make better trading decisions.


Manage your risk: Trading forex and other financial instruments involves risk, and it's important to manage your risk effectively to avoid significant losses. Make sure to set realistic trading goals, use stop-loss orders to limit your losses, and avoid over-leveraging your trades.


Take advantage of the educational resources: Exness offers a wide range of educational resources, including video tutorials, webinars, and trading guides, that can help you improve your trading skills and knowledge. Make sure to take advantage of these resources to enhance your trading performance.


How to Open an Exness Trading AccountHOW TO OPEN AN EXNESS TRADING ACCOUNT


Conclusion
In conclusion, opening an Exness trading account is a simple and straightforward process that can be completed in a few easy steps. By following this step-by-step guide, you can start trading with Exness in no time and take advantage of their competitive trading conditions and excellent customer support.


Note: Use the link below for open a account and don't forget to add my partner code or refer code. My partner code is xptp65xo6o.

https://one.exness-track.com/a/xptp65xo6o

CM MACD CUSTOM INDICATOR IN TRADINGVIEW

CM MACD CUSTOM INDICATOR

In the world of trading, technical analysis is one of the most important tools that traders use to make decisions. Indicators are one of the key components of technical analysis, and the CM MACD custom indicator is one of the most popular among traders.


The CM MACD custom indicator is a modified version of the MACD indicator. MACD stands for Moving Average Convergence Divergence, and it is a trend-following momentum indicator that shows the relationship between two moving averages of prices. The CM MACD custom indicator takes this concept further by adding customizations that make it more versatile and useful for traders.


One of the most notable features of the CM MACD custom indicator is its ability to show multiple timeframes on a single chart. Traders can choose from a wide range of timeframes, from as short as one minute to as long as one month. This feature makes it easier to identify trends and trading opportunities across different timeframes.


Another useful feature of the CM MACD custom indicator is its ability to display divergences. Divergences occur when the price of an asset moves in the opposite direction of an indicator. For example, if the price of an asset is going up, but the CM MACD custom indicator is going down, it could be a sign that the price will soon reverse. Divergences are often used as a signal for traders to enter or exit trades.


The CM MACD custom indicator also includes a histogram, which is a visual representation of the difference between the MACD line and the signal line. The histogram can provide valuable insights into the strength of a trend and can be used to identify potential reversals.


Overall, the CM MACD custom indicator is a powerful tool for traders. It combines the strengths of the MACD indicator with customizations that make it more versatile and useful. Traders can use it to identify trends, divergences, and potential trading opportunities across multiple timeframes. Whether you are a beginner or an experienced trader, the CM MACD custom indicator is definitely worth adding to your toolbox.


There are several ways to use the CM MACD custom indicator in your trading strategy. Here are a few examples:


Trend identification: One of the most common uses of the CM MACD custom indicator is to identify trends. When the MACD line is above the signal line, it's a sign that the asset is in an uptrend. Conversely, when the MACD line is below the signal line, it indicates a downtrend. Traders can use this information to enter trades in the direction of the trend.


Divergence trading: As mentioned earlier, divergences between the CM MACD custom indicator and price can be a sign of an upcoming trend reversal. When the price is making higher highs, but the MACD line is making lower highs, it's called bearish divergence, which suggests that the price may soon start to fall. Conversely, when the price is making lower lows, but the MACD line is making higher lows, it's called bullish divergence, which suggests that the price may soon start to rise.


Support and resistance levels: This indicator can also be used to identify support and resistance levels. When the MACD line crosses above the signal line, it's a sign of bullish momentum and could be a support level. Conversely, when the MACD line crosses below the signal line, it's a sign of bearish momentum and could be a resistance level.


Timing trades: Traders can also use this indicator to time their trades. For example, when the MACD line crosses above the signal line, it's a sign of bullish momentum and could be a good time to enter a long trade. Conversely, when the MACD line crosses below the signal line, it's a sign of bearish momentum and could be a good time to enter a short trade.


CM MACD CUSTOM INDICATORCM MACD CUSTOM INDICATOR


Conclusion

In conclusion, the CM MACD custom indicator is a versatile tool that can be used in a variety of ways to help traders make better decisions. Whether you are a day trader, swing trader, or long-term investor, the CM MACD custom indicator can provide valuable insights into market trends, divergences, and support and resistance levels. By incorporating this indicator into your trading strategy, you can improve your chances of success in the markets.

Momentum Indicator: A Powerful Tool for Technical Analysis

Momentum Indicator: A Powerful Tool for Technical Analysis


If you're a trader, you know that technical analysis plays a vital role in making informed trading decisions. Among the many indicators used in technical analysis, the momentum indicator is one of the most widely used and trusted tools. In this article, we will discuss what momentum indicator is and how it can help you improve your trading performance.


What is Momentum Indicator?

Momentum indicator is a technical analysis tool that measures the speed of price movement over a given period. It is calculated by subtracting the closing price of an asset X days ago from the current closing price and plotting the result on a chart. This calculation provides a graphical representation of the strength of the trend of an asset, helping traders to identify potential buying or selling opportunities.


The momentum indicator can be used to identify three different types of signals:


Overbought and Oversold Conditions

When the momentum indicator moves above the overbought level, it indicates that the asset is overbought, and the price may soon reverse. Conversely, when the momentum indicator falls below the oversold level, it indicates that the asset is oversold, and the price may soon rebound.


Divergence

Divergence occurs when the momentum indicator moves in the opposite direction to the price. It signals that the trend is weakening, and a reversal may be imminent.


Momentum Shifts

When the momentum indicator changes direction, it signals a shift in the trend. This can provide an early warning of a potential trend reversal.


How to Use Momentum Indicator?


To use the momentum indicator effectively, traders must understand its limitations and how to interpret its signals correctly. Here are some tips to help you get started:


Determine the Appropriate Timeframe

The time frame used in the calculation of the momentum indicator affects its accuracy. Short-term traders may use a shorter period, while long-term traders may use a longer period. Experiment with different timeframes to find what works best for you.


Use in Conjunction with Other Indicators

Momentum indicators should not be used in isolation. They should be used in conjunction with other technical analysis tools to confirm trading signals.


Interpret Signals Correctly

The momentum indicator provides trading signals, but it's up to the trader to interpret them correctly. Avoid relying solely on the momentum indicator and always consider other factors, such as market news and economic data.


Practice Risk Management

As with any trading strategy, risk management is essential. Always use stop-loss orders to limit potential losses, and avoid risking more than 1-2% of your trading capital on any single trade.


Specifically, the momentum indicator can be used in various trading strategies, such as trend following and momentum trading. Trend following involves identifying an asset that is trending and buying or selling it based on the momentum indicator's signals. Momentum trading, on the other hand, involves buying or selling an asset based on its recent price movement, as indicated by the momentum indicator.


It's worth noting that the momentum indicator can be used on any financial instrument, including stocks, forex, and cryptocurrencies. However, like any technical analysis tool, it has its limitations and can produce false signals, particularly in volatile markets. Traders must, therefore, be cautious when using the momentum indicator and use it in conjunction with other tools to confirm signals.


MOMENTUM INDICATORMOMENTUM INDICATOR


Conclusion

The momentum indicator is a powerful tool that can help traders identify potential trading opportunities. By measuring the strength of the trend, it can provide valuable insights into market sentiment and help traders make more informed decisions. However, it should not be used in isolation, and traders must understand its limitations and how to interpret its signals correctly. By combining the momentum indicator with other technical analysis tools and practicing sound risk management, traders can improve their trading performance and achieve greater success in the markets.


Bilateral Patterns in Technical Analysis

Understanding Bilateral Patterns in Technical Analysis


In technical analysis, chart patterns are a common tool used by traders and investors to forecast future price movements of financial assets. Bilateral patterns are a type of chart pattern that indicates a potential trend reversal or continuation in either direction. These patterns are formed when the price moves within a range or consolidation, with no clear indication of the future direction of the market. In this article, we will explore some of the most common bilateral patterns used in technical analysis.


Rectangles: Rectangles are one of the most common bilateral patterns and are formed when the price moves within a range with horizontal support and resistance levels. This pattern indicates that the market is taking a break from the previous trend and may reverse or continue in either direction after the price breaks out of the rectangle. The pattern is completed when the price breaks out of the rectangle in either direction.


Triangles: Triangles are another common bilateral pattern and can be either symmetrical or asymmetrical. A symmetrical triangle is formed when the price consolidates within a range, with lower highs and higher lows. An asymmetrical triangle is formed when the price consolidates within a range, with a flat boundary and a slanted boundary. Like rectangles, triangles indicate that the market is taking a breather before potentially resuming the previous trend or reversing in either direction. The pattern is completed when the price breaks out of the triangle in either direction.


Wedges: Wedges are similar to triangles in that they indicate a potential reversal or continuation in either direction. However, wedges are characterized by a slanted boundary on both sides, indicating that the price is moving in a narrowing range. A rising wedge has a slanted upper boundary and a slanted lower boundary, while a falling wedge has a slanted upper boundary and a flat lower boundary. The pattern is completed when the price breaks out of the wedge in either direction.


Diamond: A diamond pattern is a less common bilateral pattern that is formed when the price consolidates within a range, with a diamond shape formed by two triangles. This pattern indicates that the market is uncertain about the future direction of the asset, and a breakout in either direction can occur. The pattern is completed when the price breaks out of the diamond shape in either direction.


Bilateral patterns can be powerful tools for traders and investors, as they can help to identify potential trend reversals or continuations in either direction. When a bilateral pattern is identified, traders can use technical indicators, such as moving averages and trend lines, to confirm the pattern and set entry and exit points for their trades.


It's important to note that bilateral patterns can be less reliable than other chart patterns, such as reversal or continuation patterns, as they do not provide a clear indication of the future direction of the market. Traders should use bilateral patterns in conjunction with other technical and fundamental analysis tools to make informed trading decisions. Additionally, traders should consider the broader market trends and news events that may impact the asset being analyzed.


Traders and investors should also be aware of false breakouts when trading bilateral patterns. A false breakout occurs when the price breaks out of the consolidation or range, but then quickly reverses back into the pattern. This can result in losses for traders who entered the trade based on the breakout signal. To avoid false breakouts, traders can use additional technical indicators, such as trading volume or momentum indicators, to confirm the breakout before entering a trade.


Furthermore, traders can also use the measured move technique to set profit targets for trades based on bilateral patterns. The measured move technique involves taking the distance between the support and resistance levels of the pattern and projecting it from the breakout point. This can provide a target price for traders to take profits.


BILATERAL PATTERNSBILATERAL PATTERNS


Conclusion

In conclusion, bilateral patterns are an important tool for traders and investors in technical analysis. These patterns can indicate potential trend reversals or continuations in either direction and can be used in conjunction with other technical and fundamental analysis tools to make informed trading decisions. However, traders should be aware of false breakouts and use proper risk management techniques to manage their trades. By using bilateral patterns effectively, traders can potentially profit from the volatility and uncertainty of the markets.


Understanding Continuation Patterns in Technical Analysis

Understanding Continuation Patterns in Technical Analysis


Technical analysis is a popular tool used by traders and investors to forecast future price movements of financial assets. One of the key concepts in technical analysis is the idea of chart patterns, which are recurring formations in the price chart that can signal a potential trend reversal or continuation.


Continuation patterns are a type of chart pattern that indicates the resumption of an existing trend after a brief period of consolidation. These patterns are formed when the price moves sideways or consolidates within a range, indicating that the market is taking a breather before continuing in the same direction as the previous trend. Here are some of the most common continuation patterns used in technical analysis:


Flags and Pennants: Flags and pennants are two similar continuation patterns that are formed when the price moves in a narrow range after a sharp move in one direction. Flags are characterized by a rectangular pattern, while pennants form a triangular shape. The pattern is completed when the price breaks out of the pattern in the direction of the previous trend.


Symmetrical Triangles: Symmetrical triangles are formed when the price consolidates within a range, with lower highs and higher lows. This indicates a balance between buying and selling pressure in the market. The pattern is completed when the price breaks out of the triangle in the direction of the previous trend.


Ascending and Descending Triangles: Ascending triangles are formed when the price consolidates within a range, with a flat upper boundary and a rising lower boundary. This indicates that buyers are becoming increasingly confident and may push the price higher. Descending triangles are the opposite, with a flat lower boundary and a descending upper boundary, indicating that sellers are gaining momentum.


Rectangles: Rectangles are formed when the price consolidates within a range, with horizontal support and resistance levels. This pattern indicates that the market is taking a break from the previous trend and may resume in the same direction after the price breaks out of the rectangle.


Continuation patterns can be powerful tools for traders and investors, as they can help to identify potential buying and selling opportunities. When a continuation pattern is identified, traders can use technical indicators, such as moving averages and trend lines, to confirm the pattern and set entry and exit points for their trades.


It's important to note that continuation patterns are not always reliable, and traders should use them in conjunction with other technical and fundamental analysis tools to make informed trading decisions. Additionally, it's important to consider the broader market trends and news events that may impact the asset being analyzed.


Continuation patterns are particularly useful for traders who employ trend-following strategies. These patterns can provide valuable information about the strength and direction of a trend, allowing traders to ride the trend and potentially profit from it.


It's important to note that continuation patterns can take different forms and can appear in different timeframes. For instance, a flag pattern on a daily chart may indicate a continuation of a trend that is visible on a weekly chart. Traders should therefore consider the context of the pattern and the broader market trends when making trading decisions.


Another important consideration when trading continuation patterns is the concept of false breakouts. A false breakout occurs when the price breaks out of a continuation pattern but then quickly reverses back into the pattern. This can lead to losses for traders who entered the trade based on the breakout signal. To avoid false breakouts, traders can use additional technical indicators to confirm the breakout, such as trading volume or momentum indicators.


In addition to the patterns mentioned above, there are other continuation patterns that traders may encounter, such as the bullish and bearish flags, the triple top and bottom, and the cup and handle pattern. Each of these patterns has its own unique characteristics and can provide valuable information about the market.


CONTINUATION PATTERNSCONTINUATION PATTERNS


Conclusion

In conclusion, continuation patterns are an important tool for traders and investors who use technical analysis to make trading decisions. These patterns can provide valuable information about the direction and strength of a trend, allowing traders to potentially profit from the resumption of the trend. However, traders should always use these patterns in conjunction with other technical and fundamental analysis tools, and should have a sound risk management plan in place to manage their trades.

POPULAR POSTS