Stochastic Oscillator Indicator : A Tool for Technical Analysis
If you're an investor or trader in the financial markets, you might have come across the term "stochastic oscillator" as a technical analysis tool. It's a popular indicator used by traders to identify potential trend reversals, overbought or oversold conditions, and to generate buy or sell signals. In this article, we'll explore the concept of stochastic oscillator and how it works.
What is Stochastic Oscillator?
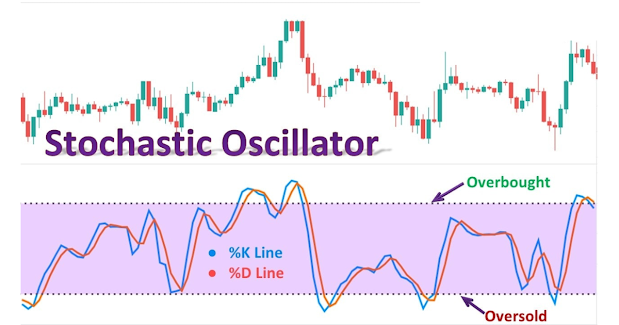
Stochastic oscillator is a momentum indicator that compares the current closing price of a security with its price range over a specified period. It measures the speed and direction of price movements and helps traders to determine potential turning points in the market.
The stochastic oscillator comprises two lines: %K and %D. The %K line is the main line, and the %D line is the signal line. The %K line is calculated using the following formula:
%K = 100 x [(C - L5) / (H5 - L5)]
Where C is the current closing price, L5 is the lowest low of the last five periods, and H5 is the highest high of the last five periods. The %K line oscillates between 0 and 100, with readings above 80 indicating overbought conditions, and readings below 20 indicating oversold conditions.
The %D line is a 3-period moving average of the %K line and is calculated as follows:
%D = (K1 + K2 + K3) / 3
Where K1, K2, and K3 are the previous %K values. The %D line is plotted alongside the %K line, and it's used as a signal line to identify potential buy or sell signals.
How does Stochastic Oscillator Work?
The stochastic oscillator works by comparing the current closing price of a security with its price range over a specified period. It helps traders to identify potential trend reversals and overbought or oversold conditions.
When the %K line crosses above the %D line, it's considered a bullish signal, indicating that the security is oversold and could potentially rise in price. Conversely, when the %K line crosses below the %D line, it's considered a bearish signal, indicating that the security is overbought and could potentially fall in price.
Traders also use the stochastic oscillator to identify divergences between the oscillator and the price of the security. A bullish divergence occurs when the price of the security makes a new low, but the stochastic oscillator makes a higher low. This indicates that the momentum of the security is turning bullish. A bearish divergence occurs when the price of the security makes a new high, but the stochastic oscillator makes a lower high. This indicates that the momentum of the security is turning bearish.
Limitations of Stochastic Oscillator
Like any technical analysis tool, the stochastic oscillator has its limitations. It's not always accurate, and traders should use it in combination with other technical indicators and analysis tools. The stochastic oscillator can also generate false signals in choppy or sideways markets, and traders should be cautious when using it in these conditions.
Advanced traders may also use different settings for the stochastic oscillator depending on their trading style and the market they are trading in. For example, a shorter time period may be used for day trading or scalping, while a longer time period may be used for swing trading.
It's also important to note that the stochastic oscillator is not a standalone trading strategy but is rather a tool to be used in conjunction with other technical analysis tools and strategies. Traders should also consider fundamental factors such as economic data and company news when making trading decisions.
In addition to the traditional stochastic oscillator, there are also variations such as the slow stochastic and the fast stochastic. The slow stochastic is similar to the traditional stochastic but uses a slower moving average for the %K and %D lines, resulting in less frequent but more reliable signals. The fast stochastic uses a shorter time period for the %K and %D lines, resulting in more frequent but potentially less reliable signals.
Conclusion
The stochastic oscillator is a popular technical analysis tool used by traders to identify potential trend reversals, overbought or oversold conditions, and to generate buy or sell signals. It's a versatile tool that can be used in combination with other technical indicators and analysis tools to improve trading decisions. However, traders should be aware of its limitations and use it with caution.


No comments:
Post a Comment